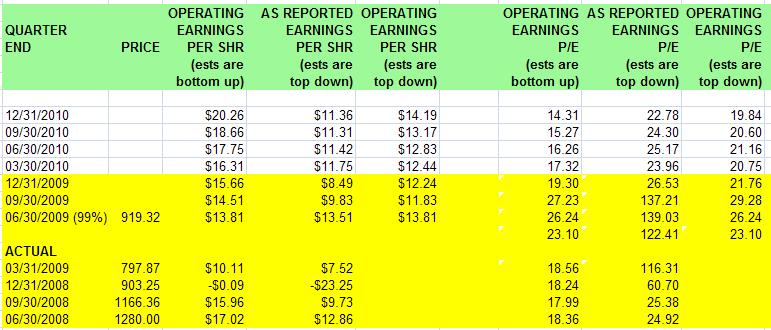
Valuation - Price / Earnings Ratios:
Actually, I was discussing the topic of P/E in this post: The Long View - Aug 27, 09. Now why am I calling P/E a sentiment indicator? I posit that P/E is as much a sentiment tool as it is an objective valuation tool. And it is too high currently (as it was back in March) for a meaningful bottom.
To explain why, let's think about what P/E means. It is the the "payback period" for a stock's current earnings to justify/cover the current share price. Another way to look at it is the *premium* that you place on the stock's ability to generate future earnings. Earnings theoretically grow for growing companies, or they are stable and consistent for well-run companies. But shouldn't a P/E for a particular company or even a sector be a well-known and consistent metric? Why would anybody pay a premium on P/E beyond the historical average P/E?
Because investors are emotional. They fall prey to greed and fear, optimism and pessimism.
Moreover, large scale herd-behavior for optimism and pessimism actually runs in cycles. Read this article, it is a fantastic description of this valuation cycle: http://www.zealllc.com/2007/longwave3.htm. The main upshot of the article is that these long valuation waves take about 32-36 years to run, the last bottom was in 1981, and valuation bottoms do not occur until the broad market (as measured by P/E's on the Dow or the S&P 500, which have very similar P/Es most the time) P/E is between 6-10. Long Term (100 year) average P/E is ~14.
So lets see what the data is saying for the S&P 500. All of the data shown is taken directly from Standard and Poors: http://www2.standardandpoors.com/spf/xls/index/SP500EPSEST.XLS

Furthermore, P/Es can be reported against actual GAAP earnings or Operating earnings. There are pros and cons to both approaches but always be aware of both metrics.
So looking back at March 09, 2009 (SPX @ $666) right before earnings season. Let's use Twelve Month Trailing earnings for March 31, 2009. TTM actual earnings were $6.86 which gives a P/E of 97.1!!! TTM operating earnings were $43.00 which gives a P/E of 15.5. So in actual terms, P/E was still nearly triple digits. But even in operating terms, the P/E was still above the long term average and nowhere near 6-10. .... Doesn't seem like a P/E bottom to me.
Now, lets go to Sept 23, SPX @ 1080. TTM actual earnings are $7.51 => P/E of 143.8!!!. TTM operating earnings are $39.79 => P/E of 27.1!!
... are you kidding me?
Okay, lets give the "analysts" the benefit of the doubt. Lets use Q409 TTM earnings (again based on analyst estimates, which are arguably very pollyannaish) which gets past the negative earnings quarter from Q408. TTM earnings estimates are $39.35. and lets use the SPX high of 1080 for a comparison. => P/E of 27.5!!. Okay, lets go to operating estimates. TTM op est are $54.09 => P/E of 20.0!!
.... again, I ask what is this market smoking?
I have shown that P/E's did not once during the crisis reach anything approaching a bear market valuation bottom when compared against the historical record. And I am showing now that even for end of year estimates, from S&P itself!, (which most agree are *very* optimistic) the P/E is still vastly greater than the long term historical average and still in bubble territory.
Which brings me back to P/E as a sentiment indicator.
People right now are buying the hype. They buy the upgrades from Wall St. analysts. They buy the "turned the corner" rhetoric from economists. Nobody seems to remember this from the 2007 top or the 2000 top. SENTIMENT and RHETORIC is always extremely optimistic at the top! So they go back to the default "this time its different" mentality, buy the hype and pay the premium on the market with respect to valuation.
Changes happen at sentiment extremes. And I think the social mood with respect to the broad market valuation has much ... *MUCH* further to fall.
Bullish Percentage SPX
Bullishness peaked over over 2007 peak and now it is turning around. Will it wind down gradually? or fall off the cliff (a la Thelma and Louise). Meteoric rises lead to meteoric falls, that's all I'm sayin.

Options Put Call Ratio
The put call ratio, which was very bullish right up to the peak, which is exactly what we expected to see, is now starting to show a change. We have an uptrigger of the EMA 20 over the SMA 100. While subject to whipsaws, this indicator often helps to confirm trend changes.
Also look at the note at the bottom of the chart regarding the CPCE. This was unchanged from the chart I posted 2 weeks ago.

This says to me that option investors are also beginning to smell a trend change in the air.
VIX
Since the low on Sept 23, we have had a *very* impulsive move up on the VIX

I also can count the move down from the peak last year as a complete move. This medium count is interesting in and of itself, including the down sloping trendline which was resistance for several months and is now acting like support.

But what is far more interesting is an examination of the VIX since 1994. A very important central line of action can be observed (VIX of 23). Look at the important peak reversals denoted by the blue arrows. Also look at the massive fight that takes place about this central line between 1997-2003 and again 2007-2008.

What is *very* interesting is that this correction has bottomed smack dab on that line. Coincidence? ... Not in my book.


