I have written several posts the past several months talking about the long term. As most of these posts talked about problems in the economy, outlooks of future weakness, and the serious issues with our nation's monetary policy, I have a decidedly bearish forecast on most asset classes for the next several years. And since many of these observations have taken place in a fairly spectacular bear market rally, I have been labeled a perma-bear and been somewhat ignored. No worries, that is not new territory for me :)
But as we start closing in on the end of the bear market rally (Primary Wave 2), I want to rehash some of these issues. Undoubtedly I will be labeled by even more people as a perma-bear, because every government economist is declaring "end of the recession" and analysts are all declaring "new bull market".
But I assure you I am not, in fact I would rather be long. I went long big time at 700 on the SPX. I did cash out of them far to early, and went short far too early, but that is because when I look at the economy I do not see strength. Not now, and certainly not for the future. I try to be honest with myself with my analysis, both fundamentally and technically. I am not a bear for the sake of being a bear. I try to be as realistic as I can be. Sometimes that means I get things wrong (and yes, being too early is wrong in my book), and that's fine. Just part of the game. But these are my honest opinions.
FundamentalsThere are still so many long term issues that have not been dealt with. The economy is still structurally the same (70% consumer spending) and besides a lot of optimistic rhetoric, none of the problems that got us into this mess have been fixed. There have been a lot of band-aids applied. And even to an open festering wound a band-aid will apply some "relative" amount of relief (vs. doing nothing) in the *very short term*. But if you have a severed carotid artery and you put on a band-aid, it will soak up excess blood for a couple of seconds, before that band-aid becomes saturated and is no longer effective. The stimulus has stopped the free fall in a number of economics indicator "bleed-outs", but have they "fixed" anything? And the "it can't get any worse" defense is not valid. Because it can, and I believe it will.
EarningsA slight improvement, and yet so much garbage. Earnings estimates all through 2007 to the beginning of 2009 we overly optimistic and always revised downward after the fact. So around March/April we had earnings estimates from reputable analysts such as Mauldin at $40 of S&P. Now everything is better, the economists say so, and all of a sudden 2009 estimates from Wall Street are back to $60.!! LOL! Whew, thank goodness! Crisis averted! Raise all estimates by 50%. .... nice. So Wall Street has shown repeatedly in the past it's bias in using a "success-oriented" estimates (and for anyone who works in the Aerospace industry, that phrase, particularly when used in conjunction with schedules, should send up some big red flags).
PEs using the "optimistic" $60 for 2009
March @ 666 = P/E of 11.1
Today @ 1023 = P/E of 17.1
PEs using the "average" $50 for 2009
March @666 = P/E of 13.3
Today @1023 = P/E of 20.5
PEs using the "realistic" $40 for 2009
March @666 = P/E of 16.7
Today @1023 = P/E of 25.6
Few salient points to remember: $60 is an estimate!!! 12 months trailing earnings are still around $40.
And absolutely none of these hit bear market territory bottoms for valuation. Rule of 20 is BS. Average P/E for the last 10 years of 17 is BS. We are in a bear market, and you have to do P/E comparisons with historic bear market bottoms (P/E between 6 and 10 for the broad market indicies - SPX or INDU). Inflation arguments for P/E are also invalid. Because P/E is "inflation neutral" (Prices are inflated and Earnings are inflated, so P divided by E removes inflation effects).
P/E is as much a sentiment tool as it is an objective valuation tool. And it is too high currently (as it was back in March) for a meaningful bottom
--- Update: I wrote a newer post that talks about P/E and calculation of this metric at a few points during the rally: Sentiment: P/E, BPSPX, VIX and CPC. Please see this for more informationOption-ARMs and Rising Mortgage Delinquency RatesHere is a 60-minutes piece (exceptionally informational and well done) on the upcoming Option ARM wave. If you have not watched this, please do so
here . Actually, even if you have watched it, watch it again. This is a BIG DEAL.
The jist is, that the second wave of the mortgage meltdown has not yet hit, and we are just at the very beginning of the second wave. Check out the chart at 3:48 of the video above. Now couple this with the unemployment observations I have made above. When these mortgages all reset to higher rates, do you think that the economy will escape from the huge number of default rates, especially from the newly unemployed? Do you have any clue what this will do to consumer spending for people that can now just barely afford their mortgage? Do you honestly believe that we can refinance our way out of this mess (which would just further push the problem out instead of fixing it, despite that fact that this won’t work to begin with).
Then after option ARMs, people are starting to default on regular mortgages. Not subprimes, not teasers, but good old 30 year fixed delinquency rates are going up. And very few people are talking about that too. It is a small trend now, but growing. And in a society where there is a lot of home ownership and rising unemployment, mortgage exposure is a liability. Financials still have **huge** mortgage exposures and the consumer outlook is not good. Which makes mortgage exposure even more risky in the future.
Economic OutlookWhy we are in a long term “secular” bear market.
I have discussed this in many places and have remarked on this in many blog posts. I will refer you to this post for the majority / fleshing out of my argument
Still Bearish: FA and TA on S&P500, Observations on the Economy May 10, 09 -
LINK.
But let me summarize briefly here:
- Consumer spending makes up 70% of GDP
- Consumer is getting squeezed
- Consumer is spending less
- Consumer, despite spending less, are still losing their jobs
- Unemployment is rising (despite pauses / minor corrections in the rate)
- Consumer are therefore defaulting on mortgages
- Much mortgage debt has been “monetized” by the Fed via the bailout / takeover of Fannie and Freddie
- However a brand spanking new wave of mortgage defaults are occurring – Option ARM resets
- There is still so much bad debt hanging over the economy and much of it will be either defaulted upon or monetized (and despite what the Fed or Keynesians tell you, is not a significantly “better” option)
- Monetization has been an overused band-aid, and is now saturated with the dripping puss from the economy (sorry to be so graphic). The is done to avoid short term pain, but is destroying the value of the US Dollar
- A currency crisis in the Dollar is almost inevitable at this point
- Look at the Treasury market for a clue. During the deleveraging crisis in 2007-2008, safety was sought in Treasuries, now at bubble proportions. Since the subsequent Quantitative Easing (fancy / almost misleading term for monetization) and the value of the Dollar has been further depreciated, will Treasuries continue to be the save haven during the next crisis?
- Going back the consumer for a minute: consumers spend less which hurt business, but also the government
- Tax Revenues are Down
- Municipalities and States are insolvent and on the verge of bankruptcy
- What will happen: Denial of Services (social unrest) or will they get bailed out by the Fed and Treasury (further monetization of debt)
- GDP: The biggest growth sector is … the government
- The government does not have a wealth, all it has are claims on future tax revenue of US citizens and debt that it can sell to foreign governments (more in a minute)
- So when the government grows it is not growing the GDP truly. Any effect is temporary because it is paying for it through deficit spending or dollar devaluation (or both)
- Which mean in real terms (in devalued / inflation-adjusted dollars) GDP is severely contracting.
- China is not growing as strongly or as sustainably as many suggest:
Steve Saville: Getting Some Things Straight Regarding China- If China continues of the path of holding the yuan fixed relative to the dollar, it will have it is own inflation nightmare to begin with (read article above for explanation)
- China will likely need to stop purchasing new US Treasury debt at the levels they used to (it is unclear what they will do with their current US holdings, but they have already begun rotating into commodities)
- This means the Fed will have to continue to step up buying US Treasury debt (to keep interest rates low so that we can “borrow our way out of this mess”).
- This further debt monetization further undermines the dollar, and furthers the likelihood of a currency crisis in the dollar.
- Businesses are by and large NOT doing well
- The past 2 quarters have seen earning growth relative to the previous quarter.
- Revenues for leading companies have grown slightly (relative to previous quarter), but across the board, they are mostly flat or down
- Compared to a year ago, earnings and revenues are in the toilet.
I could go on and on. But you get the picture. The outlook for any “true” GDP growth (that is growth that is not driven by government spending) is bleak due to all the points made above.
The problem, as you have surmised, is debt. There is simply too much of it. At the core, this is the issue that must be dealt with.
SentimentSo we have a disconnect right now on several fronts:
- Economists are declaring the recession is over
- Politicians are pointing to "green shoots" as proof that the stimulus "worked" ("working" being sustainable economic growth vs. a temporary economic sugar rush)
- All of the observations I made above are still valid, there is still long term risk that has absolutely not been mitigated in the last 6 months
Yet the stock market rallies. And the "conventional wisdom" is that the stock market is forward looking by 6-9 months, and now that the economists are blaring the trumpets, do we take it on faith that everything is fixed and dive into the "Long" Pool head first?
I would think twice before doing so and consider that all of the upgrades by Wall Street and "turned the corner" pronouncements have come in the middle of investor euphoria. Sentiment is a big deal and turning points occur at extreme sentiment.Since the current rally is just a bullish correction in a secular bear market (at least I assert it is), it makes it the ultimate bull trap (in a long term / secular sense).
The “illusion” of a new secular bull market will be extreme. Bulls will come out of the woodwork. Bears / shorts will be squeezed. There will upside capitulation.
Even in the CIL, I am hearing statements from long time bears that the current price levels are “the last chance for the bears”. These types of statements are *extremely* characteristic of a Wave 2 (we are in Primary Wave 2 now, more in a minute).
Nearly everybody will doubt the possibility of more downside, that a new bull market is here to stay.
So while the price in most of the indicies did not send up fireworks screaming "manic blowoff buying spree, P2 is done!!", a lot of the sentiment indicators are saying exactly that. And the end of P2 should be technically weak but highly euphoric.


I think this is another "X" on the P2 top checklist. So far we have:
- X - VIX Low
- X - BPSPX (and other bullish indicators) at higher highs than 2007 peak
- X - CPC at uber-bullish levels
- X - Investor Sentiment above 80%
- X - Economists declaring "end of the recession"
- X - Analysts upgrading everything
- X - "Speculative Leader" indices showing weakness / bearish divergence
- - Clear end count for P2
.... And almost on that last one. Things are certainly in place

 Edit/Update - 10/23/09Here is my updated VIX count, documented here in this post: The Market Moves Vixenishly. You can see based on the above counts and the below counts that the VIX consolidated into a *very* complex Wave 4 formation before finally breaking down below the 16 trendline and completing the move.

 The Long Count - The Big Picture
I want to talk about the big picture in Elliott Wave Terms for a few minutes.
First I am not going to comment on the Supercycle Wave, Grand Supercyle or Millennium Wave, that is will beyond the scope of this post and well beyond my investing horizon. I am trying to look out between the next week and few months for my trades and the next 15 years for my investments. Beyond that, there are way too many unknowns. So in order to understand the wavecount for a normal traders or investors time horizon, we need about 50-100 years of data to establish trend / countertrend moves. The logical start point (at least for my purposes) is the 1929 crash and the Great Depression.
The roaring 20s was the culmination of a long rally from the late 1800s (there was a panic around 1900 and again around 1910). Previous to that (within modern history, say the last 150 years) there were a number of rallies and corrections, but nothing like the run up and crash of 1920-1935. So the Great Depression was a very strong down move that corrected much of the huge run up previous to the 1929 crash. And what have we had since 1929? A very huge run up. Here the term run-un is NOT used pejoratively. Much of the was an actual true bull run with positive and increasing fundamentals..
Now I will show a chart in a second and I want to make a few things clear.
IMPORTANT: read these next several paragraphs before looking at the next chart.
The move from 1929 to 2000 was an enormously long bull run. There was nothing “fake” about this move. America was a hugely productive society and economy. This represented real growth and real value being built, and productive enterprises being formed. It was a “true” bull run. Notice that I say to 2000, not 2007. I do not believe that 2007 was the top, even though it was higher (at least on the Dow). There are many reasons, but here are the two big ones:
1) When adjusted for inflation, the “true value” of the market in 2000 is higher than it was in 2007, and
2) The Wave personality fits. 2000 was a peak in euphoria and proclamations of “market invincibility”. This was as America got rid of much of its productive enterprises that we built up over the last 60 years and put its faith in financial instruments and outsourcing as the way to maintain the “healthy economy”. The market begins its correction after the unsustainable parabolic runup in the 1990s (as this transition from healthy to unhealthy economic activity takes place). However the euphoria would not diminish and the market tried another stab at the top.
This is the textbook definition of a Wave B. “B Waves are phonies, they are sucker plays, bull traps, speculator’s paradise, or expressions of dumb institutional complacency. They are rarely technically strong, unconfirmed by other averages, and doomed to retracement by Wave C”Here is the biggest tell for 2007 being a Wave B peak. 2007 is a new high on the Dow Industrials, it is a double top on the S&P 500, and it is almost 50% lower than the 2000 peak on the NASDAQ composite. It is so highly unconfirmed that it is utterly unbelievable.
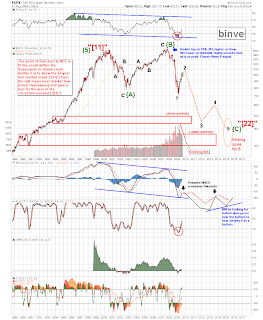
Comments on this chart and the market: I do see a 67 year long bull move (1933-2000) that results in a clear 5 wave impulse. I am calling this wave a large “[11]” (in quotation marks). Then the next move needs to be a 3-wave corrective impulse {A} {B} and {C} to make a “[22]” (again in quotation marks) . If {A} lasted 3 years and {B} lasted 4 years, I would expect {C} to last between 4 and 7 years. This will be necessary to make a proper correction in terms of time (e.g., It is unlikely to have a bull run for 67 years and a correction for only 9 years – i.e. ending now).
This of course is my opinion. But if you look at the market in terms of scale and proportionality in both price and time, this seems to make sense. So while inflation will help to prevent a crash down to say the price level of the 1960s, I don’t think it will diminish the time aspect. The market needs to correct, and there is no amount of government bailout money that can undo that process. With copious amounts of new money, the Treasury and Fed can soften the blow for a stock crash and they can (attempt to) bailout financials, but the ramification is a huge increase in the price of real goods (namely commodities). But a correction needs time to unfold. Because new money doesn’t fix the problem, it just moves the problem around.
From my point of view, this correction is going to play itself out, and need the time to do so, whether we like it or not.So, how will it unfold?
I have a guess, of course. I talked about this in my last post and I will recap it right now. The {C} wave needs time to unwind. And the {C} wave correction (which will be an impulse – C waves are ALWAYS 5’s) has only been going on since mid 2007, only about 2 years. This has not been enough time and price correction to adequately correct the bull run since the Great Depression, IMO.
So my opinion is that there is almost zero chance that 666 on the S&P 500 is the bottom. It *could* be the bottom for this year (maybe, maybe not). But I put a very high likelihood that 666 will be broken before we find any kind of true bottom.
So when I look at the body of evidence: The long EW count since the Great Depression, the failed move of 2007 on most indices to make new highs, the fact that most of the worlds stock indices moved down as the result of a global financial meltdown, the US economy still dependent mostly on consumer spending and how consumers are going to be squeezed in the coming months and years from unemployment and lower home prices, and how financials are going to get further hit by the next wave of Option ARM resets and subsequent defaults due to unemployment and lower home prices, the next wave of Credit Card default, etc. .., when I look at all of this I see a large impulsive C wave starting in 2007 and the 5-wave move from mid 2007 to March 2009 makes only the first wave (Wave 1) of that large C Wave.And I think that projection COULD look something like this:
Here is my little speil on why I think US equity prices will still drop despite the inflationary environment
--- If I thought the outcome was truly deflationary, I would be making a call for the S&P to drop to 133 (during 1929, after the initial 50% drop, the stock market dropped another 80%! over the next few years). 20% of 666 = 133. And no I do not think that is realistic given government policies. I think something like ~400 on the S&P (~4000 on the Dow) is more realistic
--- But what the big drop in the middle of inflation?
--- Because earnings still stink!
--- Additionally, simply because there is monetary inflation does not mean there will be across the board price inflation (i.e. If TMS is increased by 10%, that does *not* mean that toasters, houses and equities will also increase in price by 10%). Read these articles by Steve Saville to understand why:
Steve Saville: The Inflation Process and
Steve Saville: Market Value, Money and Credit --- Inflation is not enough to keep prices high (I think all the inflated money will find itself in real assets, most especially gold and also commodities, not the stock market), however,
I think inflation will keep prices in the stock market from dropping as low as they otherwise would--- Inflation will also help earnings from dropping in prices terms as low as they would go (in real terms they will be much lower)
--- I have said before, that the market needs to make a bottom in terms of valuation before it can go up again, and historically that is when PE is 6-10 (for the SPX and INDU). For an excellent discussion on these very long term valuation cycles, read this article,
Zeal: Long Valuation Waves--- Just for kicks, lets use PE = 8 as the bottom.
--- Earnings (GAAP) from good analysts (such as Mauldin) are around $40. And for the sake of argument, lets say they stay the same for the next few years (I see a much stronger argument that they will actually shrink, I see no compelling argument that they will grow). But lets say inflation keeps them about $40.
--- PE of 8 * $40 earnings = $320 Price of S&P at the bottom
--- This is where I get my ~400 estimate for the S&P.
--- I think we will have inflation big time, but I think the market fundamentals are so bad that they will fall regardless of inflation
--- Incidentally, my gold argument still stands. Dow at the bottom of ~$4000 / SPX at the bottom of ~$400 (not as bad as an equivalent Great Depression move) still puts Gold at $4000 eventually if you believe like I do that the Dow-Gold ratio will bottom at 1 (or even less).
--- Gold is not only an inflation hedge (true inflation = monetary inflation, which eventually finds its way *non-uniformly* into prices) but is insurance against bad economic policies and financial shenanigans.
…. Those are all of my large count assumptions and why I have come to those conclusions.
I invite you to read my points and think about them. Don’t take my word / thinking / research / analysis for it. Research these topics yourself. Think about these things, come to your own conclusions. Maybe you reach the same conclusions as me, maybe you don’t. But this is important enough to discuss and to discuss fully. Not just some aspect. Not simply taking economic data out of context and twisting it into a bullish or bearish stance. But a real honest discussion of the full scope of technicals and fundamentals.
That is ultimately why I write and post this. To share my thoughts and ideas and to have a discussion about them.Why the US Dollar is not Strong and Equities and the US Dollar Will Fall Together Over the Long TermOkay, I am probably going to rant a bit here (yeah, big shocker binv) :). But every deflationist is screaming about a bottom in the dollar and how a strong dollar will bring about the end of the equity rally.
... Uhhh, yeah. Good luck with that theory.
Because it doesn't make any sense and is completely unsupported by an examination of the long term relationship between Equities and the US Dollar Index.


---- DISCLAIMER: binve IS A LONG TERM DOLLAR BEAR ------
Short term is all noise. And the current dollar weakness is fueling the equity rally. Long term, equities will go down (due to poor fundamentals) and the dollar will go down (due to confidence crisis) together (such as 2007-2008 and numerous other occasions)
By and large, there is **far more** positive correlation between the Dollar and Equities than there is inverse correlation. They both go up
and down together as evidenced in the chart above.
However, many others including myself, have observed that the "weak dollar" is currently fueling the the equity rally right now. So why the discrepancy?
Because you need to realize that we are still in the aftermath of the Greatest Deleveraging Event in History (2008)!During the meltdown of 2008, everything was sold / redemeed for the relative "safety" (used exceptionally loosely) of Treasuries: shares in hedge funds, commodities, stocks, etc. As such there was a massive dollar repatriation. The dollar didn't gain value because it was strong! It did because it was "in the way" (you have to buy dollars in order to buy treasuries, it is sort of a necessity that way).
In the ensuing months we have seen the Fed ream bondholders through ever more massive QE salvos, intentionally destroying the "value" of US Treasury debt and the US Dollar. Since that time, money has been moving back out of Treasuries (putting downward pressure on the dollar) and into more speculative endeavors (the stock market). You can see here that there is not a "if the Dollar goes down then Equities must go up" relationship here. Money was leaving treasuries and equities were oversold so they were bought. That's it. Another force at work is the fact that the weak dollar and the oversold nature of equities a few months ago made stocks attractive to relatively stronger foreign currency holders, who could "get more bang for their Euro" so to speak.
You can see that the current inverse relationship between the Dollar and Equities is a product of a very particular setup and is
not a given. In fact, the relative valuation of all of these asset classes (Treasuries, Dollar, Foreign Currencies, and US Equities) has shifted a lot the last few months. Anybody expecting this "status-quo" relationship to persist much farther into the future is going to be rudely surprised.
So what about the future? Are the deflationists right? Does all the world's money rush back into Treasuries and the US Dollar during the next crisis? Any claim of a "strong dollar" is bunk. The Fed has made it abundantly clear that QE is not going anywhere and they are getting more aggressive with Treasury purchases, not less. So anybody who thinks that US Treasury debt will still maintain the iron-clad safe-haven status in the future.... well, I have a Bridge in Brooklyn that I think you would be very interested in!!!
Assuming You Believe Any of My Analysis Above, What Makes Sense as a Long Term Investment?Note my specific terminology "long term investment". Not trades, not something to be held for 3 months or 6 months, but what makes sense for the long term (5-15 years). For myself (I am not recommending anything to anyone else, just sharing my own thoughts on how I see the situation), the answer is primarily gold with commodities as a close second. Real Assets makes the most sense. Given the economics weakness, and the inflationary Quantitative Easing policies designed to combat / offset the weakness, real assets make the best protection. Not cash, and absolutely not Treasuries.
Will gold or oil go down in the short term? Maybe, perhaps even likely. How much? Don't know. How long might they correct? Don't know. And moreover, I do not care.
I have no interest in holding large amounts of "fake money" (US Dollars) to try to time the best purchase of "real money" (Gold). Others may play that game or even advocate it. I will not. I believe a currency crisis in the US Dollar is highly probable, if not inevitable. And maybe there will be warning signs, or maybe there won't be. This is a Black Swan event in the making, which makes the timing by definition unpredictable.
So in my investment account: I am in gold now, and I add on pullbacks.
Instead of me talking about gold here, I have a whole post very specifically focused on it, and I would highly suggest that you read it:
The Gold Blog. Gold/Silver/GSMs (and a little Oil for good measure) Jun 15, 09
Edit/Update - 9/12/09I have made an update to my mammoth gold post with all new revised charts. Click here for the updated post:
The Gold Blog. Gold/Silver/GSMs (and a little Oil for good measure) Sept 11, 09


