This is a Follow up to my last post
QE is not Inflationary, Thoughts on Risk Asset Instability -
http://marketthoughtsandanalysis.blogspot.com/2011/01/qe-is-not-inflationary-thoughts-on-risk.html /
http://caps.fool.com/Blogs/qe-is-not-inflationary/531743. I received a lot of good comments that allowed me to make clarifications to my argument. I would like to consolidate those clarifications and add a bit more to my observations. This will be a more complete post than my last one, and I think will be a useful exercise.
*** The Federal Reserve buying and selling Treasuries is a Monetary Operation, not a Financing OperationI have gone through this in detail here (
The Matter of Deficits, Sovereign Default, and Modern Monetary Theory) and here (
The US Treasury and the Federal Reserve: Redundant Institutions). Both of these pieces were influenced heavily by
The Pragmatic Capitalist who I believe understands the current reality of Fed / Treasury operations better than anybody.
Here is the highly simplified and shortened version of the two posts above:
Treasuries do not fund anything. Once upon a time (prior to 1971) they did. But they are no longer a fiscal (financing) tool. They are a monetary tool. Treasury auctions are the mechanism by which the Fed maintains its overnight rate. The Fed purchases or sells Treasuries in order to add or drain excess reserves. That's it. Open Market Operations (see
here) are how this process is carried out. Sometimes this involves new Treasury issuance to cover the amount of reserves the Fed needs add, and sometimes this involves only existing Treasuries which could come from banks, Primary Dealers, or an authorized Government Securities Trading Desk. The main point being that Treasury auctions and purchase or sale of treasuries by the Fed is a completely co-ordinated activity (by design) simply done to maintain control of their target rate, and as such will never be under-subscribed (again by design).
Note: This is different than 'Government Spending'. As I said above, Treasury issuance is entirely a monetary operation, it is not a financing operation (not since 1971). When the US Government wants to spend, it simply spends. More specifically, the Treasury credits bank accounts directly. This is exogenous to the banking system and has been termed 'vertical money creation', as opposed to 'horizontal money creation' which happens completely in the banking system. For more on this, see
here. This also illustrates why the US Government is not revenue constrained. It must first credit accounts so that money can disseminate through the economy, one use of which is to pay taxes. Neither Taxes nor Treasury Issuance 'funds' Government activities.
...
[ However government spending *MUST* be in some proportion to private sector productive capacity otherwise inflation will ensue. There is no 'free lunch' here. But the point of this section is to discuss the specifics of monetary operations, which is highly relevant to this post ]*** Excess Reserves and Bank LendingUnder neo-classical economic theory, a large amount of excess bank reserves will lead to an increase in bank lending via the
Money Multiplier Model. The very abbreviated version goes like:
In a Fractional Reserve Banking System the total amount of loans that commercial banks are allowed to extend (the commercial bank money that they can legally create) is a multiple of reserves. Which means the higher amount of reserves, the more loans / credit money can be created.
However there are a number of issues with the Money Multiplier Model in terms of being the driver of forcing monetary policy. It basically is a 'supply side' theory in which the bottleneck is the banking system. By increasing the reserves in the banking system, more loans will be made because there is a higher capacity to create loans. This does not hold up with empirical observations (see
here).
Operationally, banks are never really reserve constrained. Reserves only need to be met against a 14 day average, which means if you are a bank you can make a loan absent the required reserves at any point. Reserves can be acquired either through interbank lending or the discount window. Moreover, reserves need to be carried against demand deposits (checking accounts). Sweeps have been routinely implemented to move demand deposits into a special purpose savings account (a savings account is not a demand deposit) obviating the need for higher reserves.
In a fantastic paper by Austrian Economist Vijay Boyapati (see
here) observation has shown that bank reserve creation by the Fed actually lags banking sector lending
Given that commercial banks are effectively operating without a reserve requirement and that loan issuance is not constrained by reserves, it would be sensible to reconsider the temporal causality posited by the money multiplier theory of lending. If the causality were correct, one would expect changes in reserves to precede changes in the issuance of credit, ceteris paribus. Citing an empirical study on business cycle statistics conducted by the Federal Reserve, Steve Keen explains that the opposite is true:
…rather than [reserves] being created first and credit money following with a lag, the sequence was reversed: credit money was created first, and [reserves were] then created about a year later.
From an Austrian perspective, an empirical argument based on a temporal correlation is not definitive proof of an underlying causality — although it may be illustrative and suggestive of that causality. An explanation for the counterintuitive temporal sequence is provided in a Federal Reserve study of the institutional structure of the US banking system since 1990, conducted by Carpenter and Demiralp. They demonstrate that “reservable liabilities fund only a small fraction of bank lending and the evidence suggests that they are not the marginal source of funding, either.” Their point is that when a bank makes a loan, the matching liability used to fund the loan does not need to be reserves created by the Fed.
These are particularly relevant points, because the size of the monetary base exploded by over $1 trillion in 2008 (see
http://research.stlouisfed.org/fred2/series/BASE) and we have not seen any commensurate explosion in bank lending since 2008 (see
http://research.stlouisfed.org/fred2/series/TOTBKCR?cid=49). Also broader monetary measures like M2 and M3 (see
http://www.nowandfutures.com/key_stats.html) show the still disinflationary / deflationary monetary trends.
The problem is not a 'supply side' (bank reserves) issue, rather it is a 'demand side' (unwillingness to borrow) issue.
For inflation, which is a
persistent increase in money supply and credit resulting in a
persistent increase in prices, to take hold and become a problem the US private sector needs to borrow. And since the private sector remains in a balance sheet recession, this significantly reduces the inflationary potential in the current environment.
*** Why Quantitative Easing is not InflationaryQuantitative Easing is an asset swap.
At the end of the day, it is nothing more fancy than that. The Fed takes excess reserves and purchases Treasuries. This is
exactly the same type of operation that the Fed undertakes when trying to maintain the Fed Funds Rate as described above.
Under normal OMO, the Fed buys the short end of the yield curve. Under the Quantitative Easing 'Two' program, the Fed is mainly targeting 4 to 10 year securities (see
http://www.newyorkfed.org/markets/lttreas_faq.html).
The main goal of Quantitative Easing, as stated by Chairman Bernanke in August 2010 during his speech at Jackson Hole was to lower long term interest rates, which will stimulate borrowing and then eventually stimulate the economy. (see
http://www.federalreserve.gov/newsevents/speech/bernanke20100827a.htm)
A first option for providing additional monetary accommodation, if necessary, is to expand the Federal Reserve's holdings of longer-term securities. As I noted earlier, the evidence suggests that the Fed's earlier program of purchases was effective in bringing down term premiums and lowering the costs of borrowing in a number of private credit markets. I regard the program (which was significantly expanded in March 2009) as having made an important contribution to the economic stabilization and recovery that began in the spring of 2009. Likewise, the FOMC's recent decision to stabilize the Federal Reserve's securities holdings should promote financial conditions supportive of recovery.
The problem is QE-I and QE-II happened in completely different environments. The crisis of 2008 was primarily a deleveraging crisis. QE-I added liquidity to the banking system when it needed it after the Lehman collapse. I have discussed that previously here:
Moving Some Macroeconomic Deck Chairs: The Dollar, Dollar Swaps, Bonds and LIBOR.
However, as discussed above, the current environment is different. Excess reserves and the monetary base are at unprecedented levels. Banks are not reserve constrained. There is no liquidity crisis now. So if bank lending has not increased substantially with $1 trillion in reserves, why would an extra $600 billion make much difference? ($600 billion is the amount of Treasury securities to be purchased -
http://www.federalreserve.gov/newsevents/press/monetary/20101103a.htm)
This makes the stated
intentions of Quantitative Easing suspect. But let's put that idea on hold for a minute and focus on the
mechanics of Quantitative Easing to show why it is not inflationary.
The Fed wishes add reserves to the banking system (recall at the beginning of the post, the Fed purchasing Treasuries adds reserves to the banking system). It also wishes to change the structure of bank balance sheets so that banks are holding less Treasuries themselves and will take on more reserves (which presumably will make then more inclined to lend, ... which as was discussed above is not the problem). So in this case, the Fed does not want to buy Treasuries from the Treasury, it wants to buy the Treasuries on bank balance sheets.
In this case especially (as is often the case in OMO) the Treasuries already exist. They are already a part of the financial system. When the Fed buys these Treasuries and transfers them to its balance sheet, it gives the financial institutions an equal amount of reserves.
At the end of the transaction, there are no new net financial assets in the banking system. The
structure of the assets are different, but the
amount of assets are the same. It quite literally is an asset swap. For a more detailed description of this process, see
hereThere is no increase in money supply. The mechanics are not inflationary.
QE is actually deflationary since it takes an interest bearing asset away from the financial sector and swaps it for reserves (which currently pay only 25 bp).
The only way for Quantitative Easting to be inflationary is if all of these new bank reserves spurred an increase in lending,
and that is not happening.

The current environment is disinflationary and borrowers are not willing to take on more debt. Increasing bank reserves, based on the argument I present above, doesn't seem like it will make much difference (at least not an inflationary one), and so far that looks to be the case.
*** Who exactly are the buyers and sellers in QE-II?Yet, since the end of August after Chairman Bernanke gave his speech at Jackson Hole, almost every risk asset class has gotten a bid, and big time.
Is there some causal (yet hidden) inflationary activity occurring here?
I argue the answer is 'mostly' no .... and a lot more dangerous over the long term than an outright 'yes'.
First, addressing the Fed's stated reason for Quantitative Easing, which was to lower long term interest rates (by buying that part of the curve), we see that in fact the opposite has happened:

Longer term yields have increased since QE-II began.
So, we have an increase in long term yields (opposite of the stated intention) and we have a decrease in lending (opposite of the stated intention).
Bank reserves have increased, but bank reserves cannot be used for speculation. Bank reserves are on account at the Fed and can be used to purchase Treasuries, MBS's, or loaned interbank to those that need it for reserve requirements. This is true for all commercial banks, investment banks, primary bond dealers, or other government securities dealers who have an established trading relationship with the Fed.
..... Hmmmmm. We seem to have found a dead end in our analysis.
We have a terrific rally in all kinds of risk assets since QE was hinted at by Chairman Bernanke at the end of August, which continued with gusto when QE was officially announced at the beginning of November.
Since I have shown above the QE is not inflationary (no increase in the overall money supply), then there are three reasons for this rally.
1) "Animal Spirits" only (used intentionally pejoratively)
2) The majority of all investors mistakenly believe QE is inflationary and are simply front-running the Fed based on improper understanding
3) Something about the structure of QE is changing the liquidity in the system
I suppose we could just assume idea 1 (Keynes famous "animal spirits" idea, which basically says that anything that doesn't fit into his economic theories is just irrational behavior). While potentially the whole story, it's not a very compelling story and I would be a lazy analyst if I just left it there.
I also suppose idea 2 might work as well. But there are very smart people in the market, and I think if I could figure out that QE was not inflationary (at least highly unlikely at any rate) others much smarter than me and in control of more money would also. The flip side is that maybe they are playing off the misconceptions of others and 'front-running the front-runners'. And while I think that is part of it, that is still analytically unsatisfying and I don't think comes close to describing the sheer size of the rally the last 5 months.
I will spend the rest of this section focusing on idea 3.
Fair warning: this train of thought is my own pet theory. It may or may not hold up to scrutiny, but I believe the logic to be sound.
First lets return to the Treasury purchases. The Fed is purchasing these Treasuries through Open Market Operations. Ideally the Fed wants only banks to participate in these auctions, but they are Open Market. Which means that any Government Securities Trading Desk can bid at the auction. But lets operate under the theory that most of the Treasury sales are coming from banks. If that were the case we should see a decrease in bank holding of Government Securities starting in November (QE-II POMO is ~$75 billion per month from the FOMC statement).
This does not jive with the data:

There is a drop in November, but is not $75 billion (only about $20 billion)
Now I would like to return to the observation about bond dealers. Primary dealers are often very connected with investment banks (here is the Primary Dealer list from the NY Fed:
here). These institutions obviously have ties to the large bond holders (funds and institutions) in the world.
So while a Primary Dealer or any Government Securities trading desk can trade with the Fed, they get paid in reserves which stays on account with the Fed, and can't be used for speculation. But there would be nothing stopping a Primary Dealer buying Treasuries from the bond community (say an Investment Bank who might be a seller based on QE) and in turn selling to the Fed. This could be accomplished through the repo market via a term repo (see
http://wfhummel.cnchost.com/repos.html).
But just thinking like bond holder for a second, if a large institution (such as the Fed) with a huge amount of reserves was able to soak up a large amount of Treasury selling, then why not sell some now and purchase later? Think of it like this, if all the long term Treasury holders go to sell at the same time, prices will plummet and yields will skyrocket. But if a party steps in and says 'I am buying half a trillion or so of long term Treasuries', then why not sell part of your position and book some profits (or speculate if a large buyer is putting in a partial floor)? If a number of people think think this, and it is larger than what the Fed is purchasing, then prices will drop based on the selling pressure.
But it would be less than it would otherwise be since the Fed has announced that it is a large buyer. And since you are a bond investor, and you are smart, and you understand that QE is deflationary (from the observation above), then likely you will get a chance to repurchase your Treasuries at a better price sometime in the future (from the current selling activity and the fact that it will likely trend for some time) and prices will likely recover.
This idea jives with both the observation on the yield curve (Treasury prices are falling, not rising) and the fact the most of the Treasury selling is not coming from banks.
*** A Speculative Increase in the Price of Risk Assets and the Fed's Third MandateSo let's assume for moment that my bond market theory is correct. Is it inflationary?
No.
Again, QE does not change the amount of net financial assets in the system, it only changes the composition. But what I have described above is a way for more liquidity to be available to chase risk assets.
It is something like a
currency carry trade. An investor sells a certain currency with a relatively low interest rate and uses the funds to purchase a different currency yielding a higher interest rate. A trader using this strategy attempts to capture the difference between the rates, which can often be substantial, depending on the amount of leverage used. In a carry trade, no currency is created. Traders hold the positions on their own balance sheets and then
eventually unwind them. (The primary dealers would be the carry traders in my above example).
So even though this scenario is not inflationary, it would explain how additional liquidity could be made available for speculation.
But let's say that my idea is bunk. That there are no bond sales freeing up liquidity for speculation purposes.
It would then mean that (since I have shown there is no inflationary impact from QE) that either 'Animal Spirits' (again, I think this is ridiculous as a going-in assumption) are out in full force or everybody is front-running the Fed in a mistaken idea about the nature of QE.
My main point here is that in all three of these cases, there has been a sharp increase in risk asset prices across the board (many different asset classes) with no commensurate increase in the money supplyBoth the nature (severity) of this rally and its timing scream 'speculation' to me.
Now please, don't misunderstand what I am saying. Excess liquidity and/or the urge to speculate does not guarantee a rally. There has to be some basis for speculation, and with stocks in particular, all of dominoes did in fact line up:
a) There had to be actual GDP growth occurring (which there has been)
b) Earnings has to be growing (and they have been)
c) Corporate balance sheets had to be improving (and they did)
There are some legitimate reasons for investors to be bullish right now, and I am saying that part of the rally is for that reason. But how it has manifested, and how the market reacted in all risk assets, not just stocks, to the QE hints and then the official announcement has a speculative stench all over it.With respect to the Fed, having failed at their primary reason for QE-II (lowering of interest rates and the stimulation of more lending) could be for two reasons: i) They did not understand that this would happen (unlikely) or ii) This was not in fact their primary reason for QE-II.
In retrospect, the real reason for QE-II was so that the
Fed could add a Third Mandate:
To keep risk asset prices higher than they would otherwise beSo while I think that the next few years will likely see a continuation of this cyclical bull stock market (P/Es are in another expansion cycle right now, and the market is getting a goose from excess liquidity [potentially] and certainly excess speculation), this gets at the heart of why I think this is unstable over the long term.
I talked about many of these thoughts here:
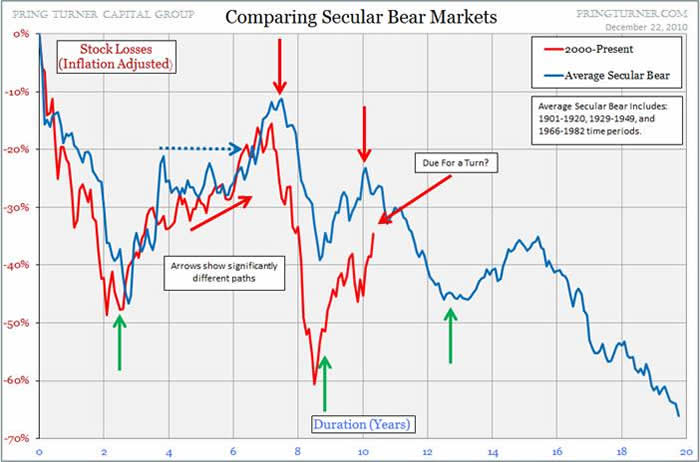
Macro Thoughts and Observations. Is the Bear Market Dead? Is this the Start of a new Secular Bull Market?Over the long term, as economic fundamentals cannot support the revenue streams to generate the earnings that artificially inflated stock prices expect to keep growing, then we have crashes. The 2000-2002 crash was based on the unsustainable dot-com valuations. The 2007-2009 crash was based on unsustainable consumer spending due to the housing bubble bursting as well as deleveraging of financial assets tied to the housing bubble. The next bubble will likely form (and pop) due to excess liquidity or excess speculation (or both) in risk assets that get completely divorced from sustainable fundamental economic drivers.
This makes this wave a bubble in motion, but I don't think it is at it's popping point yet.
Here are John Mauldin's thoughts on the FED's Third Mandate (which I completely agree with): (see: http://www.johnmauldin.com/frontlinethoughts/thinking-the-unthinkable)
The Fed has two mandates: keeping prices stable and creating an economic climate for low unemployment. I am sure I was not the only one to listen to Steve Liesman's interview of Ben Bernanke this week and shake my head at the spin he was giving us. First, let's set the stage.
In a paper with Alan Blinder early last decade, Bernanke made the case for the Fed to target a specific inflation number, and the number that came to be accepted as his target was 2%. In his famous helicopter speech in late 2002, he assured us that inflation could not happen "here," even if the short-term rate was zero, because the Fed would move out the yield curve by buying large amounts of medium-term bonds. This would have the effect of lowering yields all along the upper edge of the curve. This became known as quantitative easing. In Jackson Hole last summer, he made very clear his intention to launch a second round of liquidity-injecting quantitative easing (QE2). In that speech, in later speeches in the fall, and in op-ed pieces he said that such a program would lower rates.
Then a funny thing happened on the way to QE2: long-term rates began to rise all over the developed world. As Yogi Berra noted, "In theory, there is no difference between theory and practice. In practice, there is." It's got to be driving Fed types nuts to see the theory of QE, so lovingly advanced and believed in by so many economists, be relegated to the trash heap, along with so many other economic theories (like that of efficient markets). The market has a way of doing that.
So, Liesman asked Bernanke about one minute into the clip (link below) about the little snafu that, following QE2, both interest rates and commodity prices have risen. How can that be a success? Ben's answer (paraphrased):
"We have seen the stock market go up and the small-cap stock indexes go up even more."
Really? Is it the third mandate of the Fed now to foster a rising stock market? I wonder what the Fed's target for the S&P is for the end of the year? That would be an interesting bit of information. Are we going to target other asset classes?
Understand, I am not against a rising stock market. But that is not the purview of the Fed. And certainly not a reason to add $600 billion to the balance sheet of the Fed when we clearly do not understand the consequences. If it looks like they're making up the rules as they go along, it's because they are.
Here is the clip: http://www.cnbc.com/id/15840232/?video=1742165849&play=1
The Fed wants a risk asset rally, and it got it. And it wants the cyclical bull market to continue, and I think it will do that too. It's primary goal is to create a 'wealth effect' from a rising stock market. While that might have some short term impact, it has a very dubious long term impact:
http://pragcap.com/robert-shiller-debunks-stock-market-wealth-effect.
But keeping asset prices 'higher than they would otherwise be' will create instabilities. Which means before this cyclical bull market is over we will see another very volatile period like 2010.
Make no mistake however, excess liquidity and speculation does not equal economic activity. It will amplify stock market signals (rallies) based on economic growth (which there is), but will also amplify downturns when said growth stalls (and it will). Feedback works both ways, as any signals engineer will tell you.
QE, while not inflationary, potentially creates excess liquidity (see my scenario above) and certainly creates excess speculation which acts like an amplifier. Which means that there exists the increased potential for instability. And I don't think many people are appreciating that fact.
For some thoughts on how that could manifest, see this:
Bear Market Momentum Internals: Examination of Moving Average 'Price Stretching'


