I see London I see France .... :)
Here are a Few Charts, Globetrotter Style!
Original -
A Trip Around the Globe: A Look at a Few International Indices - Dec 10, 2009
Second Trip -
A Trip Around the Globe II: A Look at a Few International Indices - Jan 18, 2010
----------------------------------------
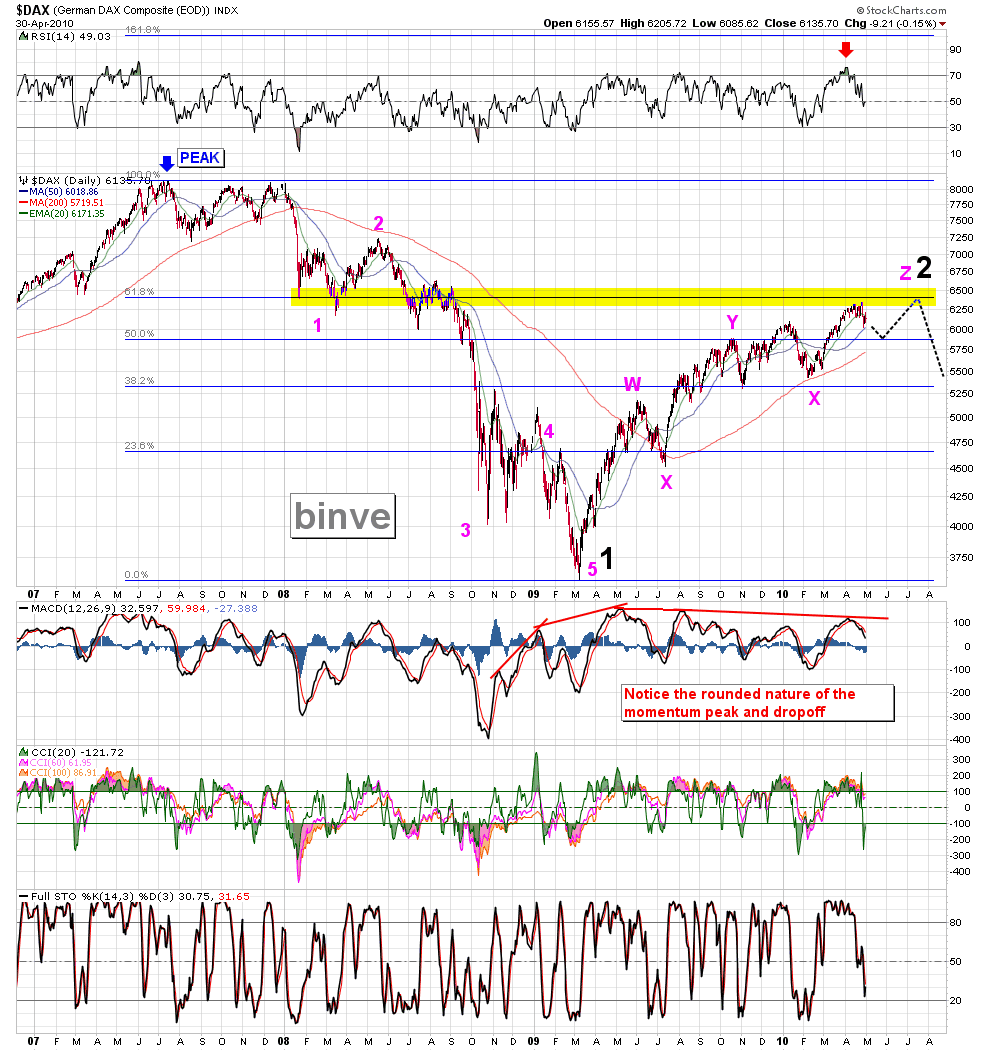
First stop Europe. The DAX, arguably the leader of the European Stock Markets, had its first scary drop in Nov/Dec (labeled as "Yowza"). The it has its next drop out of the second wedge which I labeled in my last post as "Swei Yowza".
Since then? ... nothing bullish, that's for sure. Stink-o-rama! (Don't worry, there are *much* stinkier indices coming up :) ) The indicators are approaching oversold on the daily chart, so I would not be surprised by a bounce soon. But I think that is all it will be, a short term bounce. I think these chart patterns are forecasting a *lot* more downside.

Next stop, India!
From my last post:
The BSE has had an *impressive* rise off the bottom, but its rally has maintained a distinct wedge shape (other indices have mostly morphed into a rolling top). There was a sharp pullback and then a rebound. And like the DAX above, the breakout of the first wedge is itself a wedge. I think there is a correction in the close future for the Sensex. This is a good one to keep your eye on.And what happened since then? A
HUGE gap down out of the wedge and a sell off of almost 10%! And is it done? Not a chance. Like I say on the notes in the chart, the 200 day will easily be tested, as will will support at 14000. That is another 13% down from where I am writing this.
Beyond that, I don't know. The BSE has a much stronger long term chart than the rest of the international indices (especially the United States), so I don't think the magnitude of its correction overall will be as bad as it is here. Stay tuned.

Next stop, the Far East! I have spent a lot of time writing about Asian Markets, please look through my posts for more observations:
AsiaFirst look is at the HSI. Not looking so hot my friends. It is a heavy mix of Asian/Chinese stocks and Financials. And financials are far from healthy at the moment. The HSI has two crotches and it is getting kicked in both of them at the same time.
From my last post:
It looks like a large ending diagonal. There was a breakdown, move up to the lower channel line and another breakdown. Then *another failed trendline retest (which didn't even come close to recapturing the broken trendline)*. I think this chart is saying "lots of trouble ahead". This is probably one of the most imminently bearish charts I have seen yet for a major index.Imminently bearish was right!! Holy schnikeys. Since my last post the index dropped 8%!!. And the Head and Shoulders top that I identified broke the neckline. This projects a move down to at least 19000 (another 5% move down). It is currently sitting on the 200 day MA, so don't be surprised by a bounce here. In fact the most likely scenario is that it will retest the broken neckline from underneath. I will be very surprised if it actually recaptures it. I also think the chance of that being the bottom is approximately 0.0%. This continues to be a *very* bearish chart, and the more recent price action I see on it, the more bearish I get.


Next is South Korea. It is coming up on major resistance. It tried once and was tossed back hard.
From my last post:
But now the pattern is turning bullish again. What was a down channel is now looking like a bullish flag with a break out above. It pushed through the lower resistance zone and is now consolidating. So here is the question: does it break through and try for the upper resistance zone? or does it turn down here making a double top? The indicators are suggesting bearishness, but not overly so. I don't have a super strong opinion on this chart.Well it did indeed get tossed back from the top of the lower resistance zone. Not just a little, but definitively. It does looks
exactly like a double top. So last time I did not have a strong opinion on this chart. I do now. And it is quite bearish. I think it will easily test the 200 day MA, but beyond that, I think it will try for the support zone at 1350. We will see how fast it gets there, and that should give us some clues for the long term trend.

China / via the Shanghai exchange. Read the notes, they tell the story. The only think I will add is that it is currently sitting at the bottom of the red support zone. If it breaks definitively below that, there is no meaningful support until about 2000 (about a 33% drop from where it currently is) .... yeah. Yikes is the word I would use.

Next Tokyo. I have written Several posts on the NIKKEI.
NIKKel, I Deserve at Least $0.06 For This Analysis,
If I had a NIKKel for ...., and
Long Term Count of NIKKEI back in Sept. We had an expected / predicted downturn since my last post. It is now sitting at the support of the 50 day MA. 200 day MA is close by and I think that will be tested soon as well. Beyond that is the support line at 9000 (12% down from the current price). I would definitely expect a bounce there, but 12% is a big drop in the meantime. Looks like a nice chart to short.

Next stop, South America! The Brazilian BVSP is putting on an *impressive* run!!
From last time:
Holy Cow! Will it make a new all time high? I think the odds are definitely on its side. But look at the weekly chart, the momentum is definitely not on the BVSP's side. I think there will be a correction of some magnitude (too early to tell the size) before it puts in a new all-time high. Which I still put very good odds on. The recent move is much too strong to ignore.We did indeed get weakness the past couple of weeks. The stochastics and MACD broke down like I was indicating. The drop since my last post was about 5%. And I don't think the correction is done. There is a strong support area around 60000 (about another 8% down). My guess is that there would be a bounce there. Beyond that, we will see. But I still consider this to be an impressive move, and a retest of 60000 to me says "correction" not "trend change".

Back to the USA. Looking at the weekly chart of the SPX, two words come to mind: tired and weak. Lots of negative divergence on the indicators, especially the money flow. And the top of this rally is looking very rounded indeed. Since my last post in December the size and quality of the rally has been pretty weak.
This chart does NOT look bullish.
That was what I said last time. This time: more of the same. I have
no idea why people are buying this chart.
The CMF had its first weekly negative print in over a year!!. Breadth stinks!! The stochastics are approaching 50, and if it crosses it will head to 20 it very short order (this has serious bearish implications).
This break out of the wedge looks like Galileo dropping a cannonball off the edge of the tower of Pisa. If I was prone to motion sickness I would be vomiting all over my computer screen. ... Oh wait a second, I am... excuse me.