
References for this post (please read these first):
1) Not All Five-Wave Moves Are Impulses: A Short Treatise on Elliott Wave
2) Another Impulse Wave Study: A Look at the 1974-1975 Low and Rally
3) Historical Count: 2002-2007
4) Five-Wave Structures Revisited: The Identification of an Impulse Wave
In November, I abandoned the Primary 2 count (see The Large Count).
The reason for this is very simple: The wave pattern with a top in April 2010 was a nearly perfect 62% retrace in price and 78% time relationship to what would have been Primary 1. If the market was ready to follow the path of P1/P2/P3/P4/P5 of Cycle C, then that peak should have held. Because it did not, the market was telling us (along with macro developments of the last quarter especially) that the correction (the current cyclical bull within the larger secular bear) was not over.
In fact I am convinced it is still not over. My last post discredited the impulsive wave count from March 2009 - April 2010. I have seen a lot of 5-3-5 zigzag counts for P2 in an attempt to justify that we could still be in Primary 2. I strongly disagree with this count. Is it possible? Yes. Is it likely? NO. If I had to put odds on it, I would say it was in the low single digit percentage probability. And the fact that it is still being touted as a preferred count by some is simply bad EWP practice, in my opinion.
I offered alternative explanations for the large count the last couple of months here (Thoughts on the Large Count for the New Year and The Large Count). What this count boils down to is the fact that the move from 2000-2009 completed a Cycle Degree W wave and we are currently in a Cycle Degree X wave.
Here is what that count that I was proposing looked like:

Here are some basic observations for the near term:
1) The move from March 2009 - April 2010 is not an impulse. It is best counted as a triple zigzag making it the W wave of one degree higher
2) April to July 2010 was a three wave move which stands as an X wave
3) The move up from July 2010 to now is an impulse wave (My friend Columbia has the best count from July to now and I have been following his wave count. I think it is the most correct one).
4) Since the current move is an impulse (a 5) it cannot be a Y wave. That means that the Y wave is likely a 5-3-5 zigzag meaning we will have another nominal high before the next large (>15%) correction
In short, I do not think that the resumption of the bear market ends with this wave.
.... However .....
I have been doing a lot of thinking about this the past couple of weeks and I now think the picture is even more muddy than I was anticipating. The count above assumes that the Cycle Degree X wave is a relatively fast corrective wave. And I am beginning to think that is a bad assumption. In order to illustrate my meaning and thought process here, we need some historical perspective.
Exhibit A) the NIKKEI
Here is my long EW count for the NIKKEI which I have shown previously: http://marketthoughtsandanalysis.blogspot.com/search/label/Asia

My point in showing you this is twofold.
1) Of all of the historical bear markets, the one that is most applicable to our current secular bear market is Japan's depression of the last couple decades. Macroeconomically they have a very similar situation to the one the US is in now: Private sector balance sheet recession, public sector expanding its balance sheet in an effort to spur aggregate demand, significant monetary easing efforts, bailout targeted at the financial industry, zombie banks, etc. I am not saying we will be going down a 1 for 1 path, but I am saying that of all the charts, this one will give us some clues to what's in store
2) From an EW perspective, I want you too look at the X waves. There are some precedents (assuming I counted these right, but if you are actually reading this then you have some faith in my abilities) for very complex and sideways X waves.
Exhibit B) the 1966-1974 Bear Market
X waves can sometimes be a simple bridge (like in the triple zigzag on the SPX from March 2009 - Apr 2010) where they are roughly the same same as the B waves in a 7 or 11 wave sequence. Other times X waves can be very complex and sideways and be on the same order of size and time as the W and Y waves.
So I went back to the 1966-1974 bear market (Cycle 4 of the last bull run) to re-examine it. I think it is a very relevant comparison based on how that correction played out and how ours looks so far since the beginning of 2000.

What you see in this case (since everything is fitting within a Cycle Degree wave) is a Primary W and a very complicated Primary X. It is very large in both size and time. In fact the Primary X wave is larger in both size and time that any of the Intermediate waves in Primary W.
The more I think about it, the more I am convinced that Cycle X will not be a relatively simple fast correction like I show in the first chart above. I have a feeling that this bear market is a very relevant comparison and that the form of this Primary X will give us a key to understanding our current Cycle X.
Exhibit C) A Study of Historical Bear Markets
The Pragmatic Capitalist put up a very interesting post looking at several bear markets to come up with an "average secular bear market" (http://pragcap.com/is-this-your-average-secular-bear).
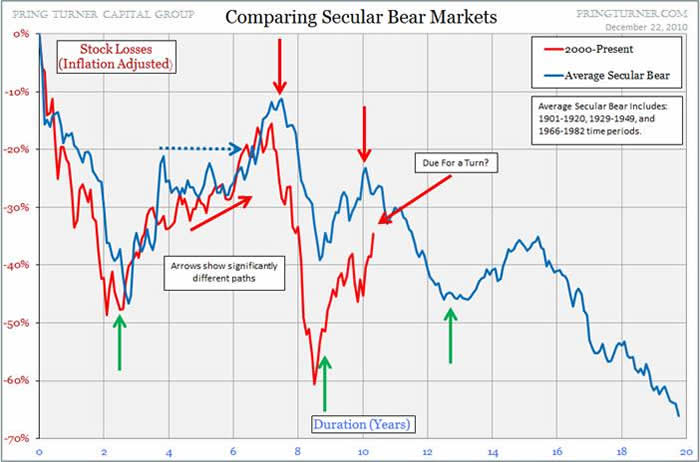
Notice first that these moves are real (inflation-adjusted) moves, not nominal moves. But the current low (March 2009) is a bit lower than average, and so I think the correction up (X Wave) will over-correct up as a longer term reaction (sort of like a mean-returning move ... as if 'average' bear markets can be analyzed like this. :) But, hey, I have to go on something, and this is better than most of the things I have seen recently). Which is another reason why I think the 1966-1974 bear market X wave is particularly relevant.
But I think the timing and the relative wave movements indicated by this chart are extremely applicable.
Okay.
So with all that preamble out of the way I wanted to show my preferred (and very ugly) long term wave count. It is influenced by my X wave observations of the 1966-1974 bear market as well as the historical bear market study above and uses that timeline as a basis for estimating the wave durations.

Here is a closer look at what might be in store for the more immediate future:

What this means is that the top that I believe we will see around July of this year will actually only be Primary W of Cycle X. I honestly think that this bear market is going to be significantly more complicated and complex than most of us are expecting.
Consider also the fact that we have had a 67 year long bull market (5 wave impulse) from the end of the Great Depression until the peak in 2000. Would we expect the correction to be over in 10 years? or 15 years? I think something on the order of 20 years is much more appropriate. If you doubt me, I would ask you to return your attention to the NIKKEI chart above and tell me how long they have been in their bear market.
The upshot is that we have very difficult times ahead of us. Based on how the macro is unfolding, I am less inclined to believe that the excesses of the past few decades will be purged in a gigantic impulsive Cycle C down. I do think we will have a violent down leg (not as impulsive as a Cycle C count would suggest) but we will have to endure violent multi-year bullish and bearish whipsaws between now and then.
Good luck to us all if I am even remotely on the right track.


