
Suggested reading:
i) Lessons (To Be) Learned... again. - Why secular bear markets have to run their courses, as do cyclical bulls and bears within secular bears.
ii) Inflation V Deflation – Which Door Do You Pick? - List of both inflationary and deflationary pressures currently at work.
iii) Inflation/Stagflation/'Flopflation' - Conditions under which prices are 'sticky' - Why I think calling what we have now 'stagflation' is misleading and will lead to the wrong conclusions. The US private sector is in a balance sheet recession. So the commodity price spikes (checklist's 'flopflation') will not stick because wages will not grow to accept them (hence commodity crashes after the spikes). ⇒ CPI is likely to be very low for the next 5-10 years. ⇒ Nominal Prices and real prices will be approximately the same for the next 5-10 years.
iv) Secular Bear Market Projection in Historical Context - Current thinking regarding the 'shape' of the secular bear market.
v) Macro Thoughts and Observations. Is the Bear Market Dead? Is this the Start of a new Secular Bull Market? - Current thinking regarding the macro surrounding the secular bear market.
vi) The Valuation Bottom of 2009: Rehashing the "Once in a lifetime buying opportunity" argument - While I agree with checklist's value proposition regarding the 2009 bottom, I still think there case to be made that we make a lower nominal and real low.
vii) http://caps.fool.com/Blogs/the-valuation-bottom-of-2009/549216#comment553546 - Summary of the above position
viii) Rebuttal to checklist :) - Rebuttal to the 'unprecedented' 3x >50% declines in a secular bear market claim.
ix) Real Secular Bear Markets
Additional reading:
1) Not All Five-Wave Moves Are Impulses: A Short Treatise on Elliott Wave
2) Another Impulse Wave Study: A Look at the 1974-1975 Low and Rally
3) Historical Count: 2002-2007
4) Five-Wave Structures Revisited: The Identification of an Impulse Wave
5) The Large Count with Historical Perspective
6) The Large Count with Historical Perspective (Part 2)
7) Macro Thoughts and Observations. Is the Bear Market Dead? Is this the Start of a new Secular Bull Market?
8) Bear Market Momentum Internals: Examination of Moving Average 'Price Stretching'
9) Lessons (To Be) Learned... again.
10) Secular Bear Market Projection in Historical Context
11) Wave Speeds and Log Charts (and No, the large count is still not an impulse)
12) The BPSPX and the Secular Bear Count
Brief Background:
The following is a brief synopsis with charts and sources for the study presented at the end of the post. Please read the above material for a more detailed background.
First is a comparison of previous secular bear markets that have a similar character to the bear market that I believe we are experiencing now. From The Large Count with Historical Perspective
| A) The NIKKEI from the last few decades. There are some precedents (especially in an index whose economy faces many similar macroeconomic headwinds we now face) for very complex and sideways X waves. |  |
| B) 1966-1975 Bear Market. X waves can sometimes be a simple bridge (like in the triple zigzag on the SPX from March 2009 - Apr 2010) where they are roughly the same same as the B waves in a 7 or 11 wave sequence. Other times X waves can be very complex and sideways and be on the same order of size and time as the W and Y waves. |  |
| C) A Study of Historical Bear Markets. The Pragmatic Capitalist put up a very interesting post looking at several bear markets to come up with an "average secular bear market" | 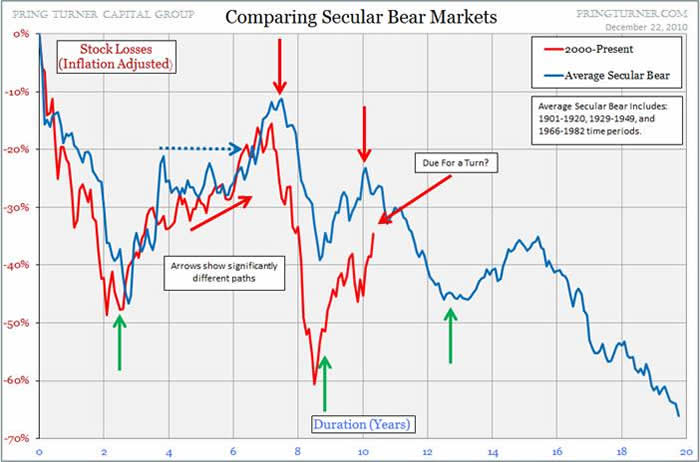 |
This leads me to what I think this secular bear market could look like for the long term:

Next is the comparison of the form of the 1966-1975 bear market to the current ongoing secular bear market. From: The Large Count with Historical Perspective (Part 2)

Here are some additional studies looking at the similarities of the momentum internals between the 1966-1975 bear market and the current secular bear. From: Bear Market Momentum Internals: Examination of Moving Average 'Price Stretching'
The 1966-1975 Bear Market:

The 2000-20xx Bear Market:

This is how my secular bear market projection fits within the historical context based on a long term trend channel analysis (see Secular Bear Market Projection in Historical Context):

Next is a study of the BPSPX with regard to the last two cyclical bull and bear markets, and the current cyclical bull market (The BPSPX and the Secular Bear Count)

Finally is a look at Real Secular Bear Markets on a long term chart:

This leads me to my long duration First Derivative Study of the S&P 500. The idea of this study is to look at the first derivative of the nominal price of the S&P 500, to identify patterns and behaviors in secular bull vs. secular bear markets.
My first iteration of this study plotted just the first derivative of the S&P 500 price. This gave a signal that was absolutely useless for long term analysis. The series was extremely noisy (unusably so) and as the price increased over time, so did the derivative (as expected) which gave no insight to the relative behavior of the price action.
My next iteration (shown below) took the first derivative of the 15 day Moving Average. The idea is to take the derivative of a 'smoother' function so that the derivative (which by definition has more noise/variation than the original function) is clean enough and patterns can be discerned. A 15 day MA is a good compromise between smoothing and data loss (important moves will be lost with longer MAs). Next is to take that derivative and divide by the price. This is done to scale the signal so that it's relative size with respect to the original price will be maintained though time.
The study has some interesting results.
First: There is a mean value band within which the derivative spends most of its time (±0.003 on the chart). The majority of the daily noise/variation stays in this band. More significant moves often occur outside this band.
Second: Secular bull markets (green in the chart below) spend most of their time in the mean value band and have only brief excursions / spikes outside the band (the 1987 crash being a glaring exception).
Third: Secular bear markets (red in the chart below) have significant periods of activity outside of the mean value band. This has partly to do with increased volatility in bear markets. But it has more to do with increased and sustained (not simply volatile) down moves as well as sharp upward reactions characteristic of bear markets (which will obviously increase the derivative).
My previous analysis (shown above) has led me to a secular bear market projection, which I show on the chart below, as well as a possible manifestation of the derivative in this context.


