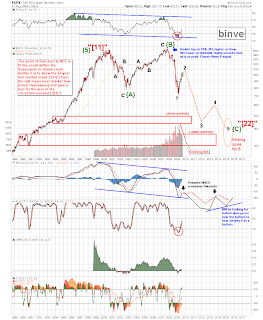
Anyways, the point of this post is to look at my projection out to the end of P2 (no I do not think it is done yet) and see how the beginning of P3 could look and some thoughts regarding the shape and timeline of P3. I showed this count idea on Monday when the Dow made a new high, but then made a cleaner version when the SPX confirmed the new high on Wednesday (Revisiting the Count). I have thought about it a little more this evening.
edit before I post: I have been drinking just a little this lovely Friday evening, so you will get a nice little rant at the end too :). Please read that as well, I believe the points and questions raised are very relevant.
So lets start at the micro level and zoom out.


Interesting note is that W = Y in this forecast. And P2 ends at the Great Bear Trendline (properly shown on a log scale)


addition Nov 14 - 1:30pm
Just adding my very long term count and projection from my Aug 27 post - The Long View. If you have not read that post yet, I would strongly encourage you to do so. It puts the analysis and observations in this post into perspective.


addition Nov 14 - 5:30 pm
Looking at the long term Russell Chart and it is showing significant weakness. This is an obvious sign of risk aversion. There is a huge risk spread (the difference between the "safe" Dow and the "risky" small caps of the Russell). If the atmosphere was really bullish, shouldn't small caps be outperforming?
Anyways, a legitimate question is: has the Russell ended its P2 already? Based on the chart there is certainly a case to be made for this. Columbia has an excellent new post discussing this option Week-end Outlook!!. I went ahead a put together a long term chart so that the overall retrace, trendline, and price action can be seen in the larger context like I show with the SPX above.

So am I crazy? Am I insane? Without a doubt.
But am I way off the mark? That is the more pertinent question.
Undoubtedly the bulls will say "yes". But believe it or not, some bears will say this projection is not bearish enough (not steep enough down).
Personally I do not find this to be that unrealistic at all.
This is a BIG DEAL! This is why I don't mind being called a "P3 cheerleader" !!! Because if this is right - even just a portion of it, maybe the fall isn't so deep -- then you need to be warned so you can TAKE ACTION !!!
This wave will destroy more wealth than you can fathom. And please do not be come the bagholder for P2.
To the Bulls
I have had so many bulls call me an idiot for not being bullish since June (I was long at the bottom and was always skeptical of this rally since May because we never got any real pullback). And also during the last couple of months -- "Don't fight the trend!", (even though the price action is mostly sideways, and only slightly trending up).
So even though I am forecasting one more up wave, do you think I will play it from the long side with any decent portion of my money? Do you think you should? Do you think a handful of percent up is worth the huge downside risk to come? And you call me the idiot?
I may be an idiot. That's fine. But after a 60% rally in 8 months, do you think the risk is now to the upside or downside. Good luck chasing a few percent of gains from the long side.
To the rest of you
Please think about this chart. Certainly don't take it as gospel. But ask yourself "is the economy actually getting better?", "is monetary policy helping or hurting the situation in a fundamental way?", and if you have not looked in the the details of the last blow-out GDP quarter, absolutely ask yourself "what parts of the economy grew, and which shrank, and how was this affected by the stimulus?", and *definitely* ask yourself "is the stimulus a good thing or a bad thing for the economy both short term and long term?"
Please think very critically about the technicals I show above and the fundamentals situation with the economy.
Good luck my friends.


